5.4 Regress - ordinary least squares estimation
The command regress is a tool for performing ordinary least square
estimations (OLS) where the dependent variable takes continuous/metrical values such as income.
Syntax:
regress <variable> <variable list> [if <condition>] [, <options>]
The dependent variable must be entered first, followed by the
explanatory variables. Options can be used for various purposes, such as robust or cluster estimation, cf. the sections below. Like other
statistical commands, regression commands can be combined with an if
condition to run regressions on selected groups. For a full list of
options, use the help regress command.
In short, the model involves estimating (possible) marginal effects from a set of independent variables (explanatory variables) on the dependent variable (response variable). "Marginal effect" is a measure of how much the dependent variable is estimated to increase in value, caused by an increase by one unit of measure in the respective independent variable.
The most important thing to look at when interpreting the result of a regression is the explanatory force of:
a) The model as a whole
b) Each variable
This is done by studying the significance values "Justert " ("Adjusted ") and "P > |t|" respectively.
Below is an example of the result from a regression analysis performed in microdata.no. The numbers in the lower part are linked to the different variables, while the numbers at the top refer to the analysis model as a whole.
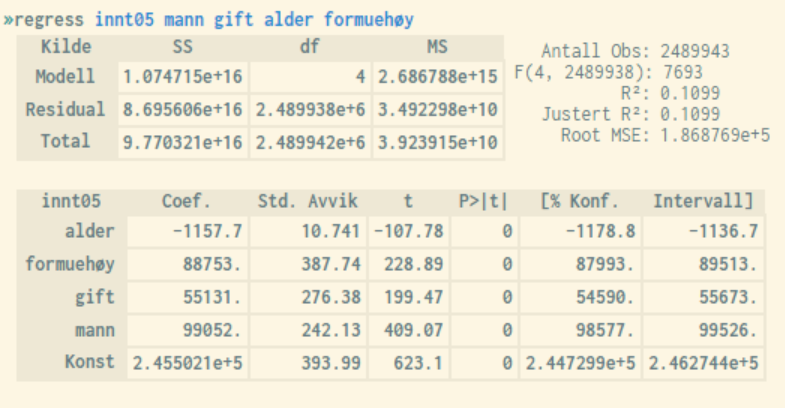
Justert (Adjusted ) is an overall measure of how much of the observed variance in the dependent variable is explained by the sum of the independent variables. The scale ranges from 0 to 1, with values near 1 being optimal. In practice, values will never reach 1 when analyzing socioeconomic individual data due to random noise and unobserved causal relationships. Typical values will therefore usually be in the range of 0 - 0.5.
The value will always increase for each additional independent variable added to the regression model. This does not necessarily mean that the model is getting better, especially if the variables added are not statistical significant. Justert takes this into account and will only increase in value if the extra variables are significant.
If Justert shows a lower value by adding an additional independent variable, this will indicate that the selected variable may have a relatively high degree of correlation with some of the other independent variables, i.e. multicollinearity. This is certainly something you should avoid.
"P > |t|" or the p-values (in column 4 in the lower regression output table) indicate the probability that the *t-*value appears as a result of pure randomness. In order to say that a variable is significant, the associated *p-*value must be lower than 0.05 at a 5% significance level. Values close to or equal to 0 are ideal.
In short, the value t (column 3) is a standardized measure of the coefficient value (= the marginal effect), cf. values in the *Coef.-*column (column 1), where limit values of +/- 1.96 correspond to a 5% significance level. Thus, values exceeding 1.96 with positive or negative sign will be considered significant at a 5% level (5% level is a common operational limit).
Also the 95% confidence interval values presented in the two rightmost columns in the lower main table are useful to study, as they are quite intuitive. If the interval includes the value 0, one can rule out that the coefficient in question shows a significant relationship between the associated independent variable and the response variable.
The coefficient values in column 1 are only relevant for significant variables, and show the marginal effect on the response variable of a unit's increase in the value of the associated independent variable.
The illustration above shows that all variables are significant with a good margin (high t-values). Alder (Age) has a negative effect on income, while the other variables have a positive effect. Konst refers to the constant, i.e. the starting value of the response variable when all independent variables take the value 0, which is of no particular interpretive importance.